How fast does the Space Station fall? It depends on the Sun
Without reboosts, NASA gives the ISS one to two years. In a 1997 NASA-contractor study, a stormy-Sun run fell about 16 times faster than a quiet-Sun run.
Prefer reading? The write-up below tells the same story with the same sources. Open on YouTube.
The numbers
stormy vs quiet Sun model run, 1997 NASA study
16×
The International Space Station is falling right now, and it has been falling every minute since it reached orbit. NASA says that if nobody pushed it back up, it would come down in roughly one to two years. One year, or two? What decides which end of that range applies is not the station’s engines or its size. It is the Sun.
Always falling, always missing
The station flies about 415 kilometers (257 miles) up, according to NASA’s FAQ on the station’s transition plan. At that height, being in orbit means falling sideways so fast that the ground keeps curving away underneath. The station never stops falling; it just keeps missing the Earth.
Most of us picture that altitude as the vacuum of space, so the natural guess is a slow, steady sink. A figure often quoted, from Wikipedia rather than a NASA primary source, fits that picture: drag lowers the station by about 2 kilometers a month on average.
The fix is a push. On 19 November 2025, according to NASA’s space station blog, the docked Progress 93 cargo ship fired its engines for over 14 minutes and 7 seconds. The orbit’s low point, its perigee, rose 2.3 miles, about 3.7 kilometers, while the high point rose just 1 mile. A slow, steady sink corrected by the occasional burn sounds like the whole story.
Why NASA’s sentence mentions the Sun
The first clue is in NASA’s own wording. The one-to-two-year lifetime comes with a condition attached: “depending on solar activity.” Why would the Sun get a say in how fast a spacecraft drops?
Because 415 kilometers is not truly empty. A trace of atmosphere is still there, thin enough that we call it space, thick enough to rub against a large structure moving at orbital speed. Every orbit, that rubbing steals a little speed.
A slower station cannot hold its height, so it drops lower. Lower down, the air is a little thicker, and the rubbing a little stronger. The fall is not a fixed rate; it depends on how much air is up there.
A safe-altitude floor that moves
That thin air is not fixed either. ESA’s station planning guide from 1997 (SP-1201), written before the station was assembled, put numbers on how much it shifts. When the Sun is quiet, the upper atmosphere thins out, and the guide says the minimum safe altitude can be as low as 350 kilometers. Around solar maximum, the atmosphere expands, and that floor rises to about 450 kilometers.
These were planning figures for a station that did not yet exist, not a rule for today’s operations. But they make the mechanism plain. The sky at a given height is not the same from one year to the next. The floor moves, and the Sun is what moves it.
Reading the Sun’s radio brightness
The Sun runs in cycles, from quiet stretches to stormy ones. One standard way to track them is the Sun’s radio brightness, an index known as F10.7 and measured in solar flux units. It matters here because it works as a stand-in for the extreme ultraviolet light that heats Earth’s upper atmosphere and makes it swell.
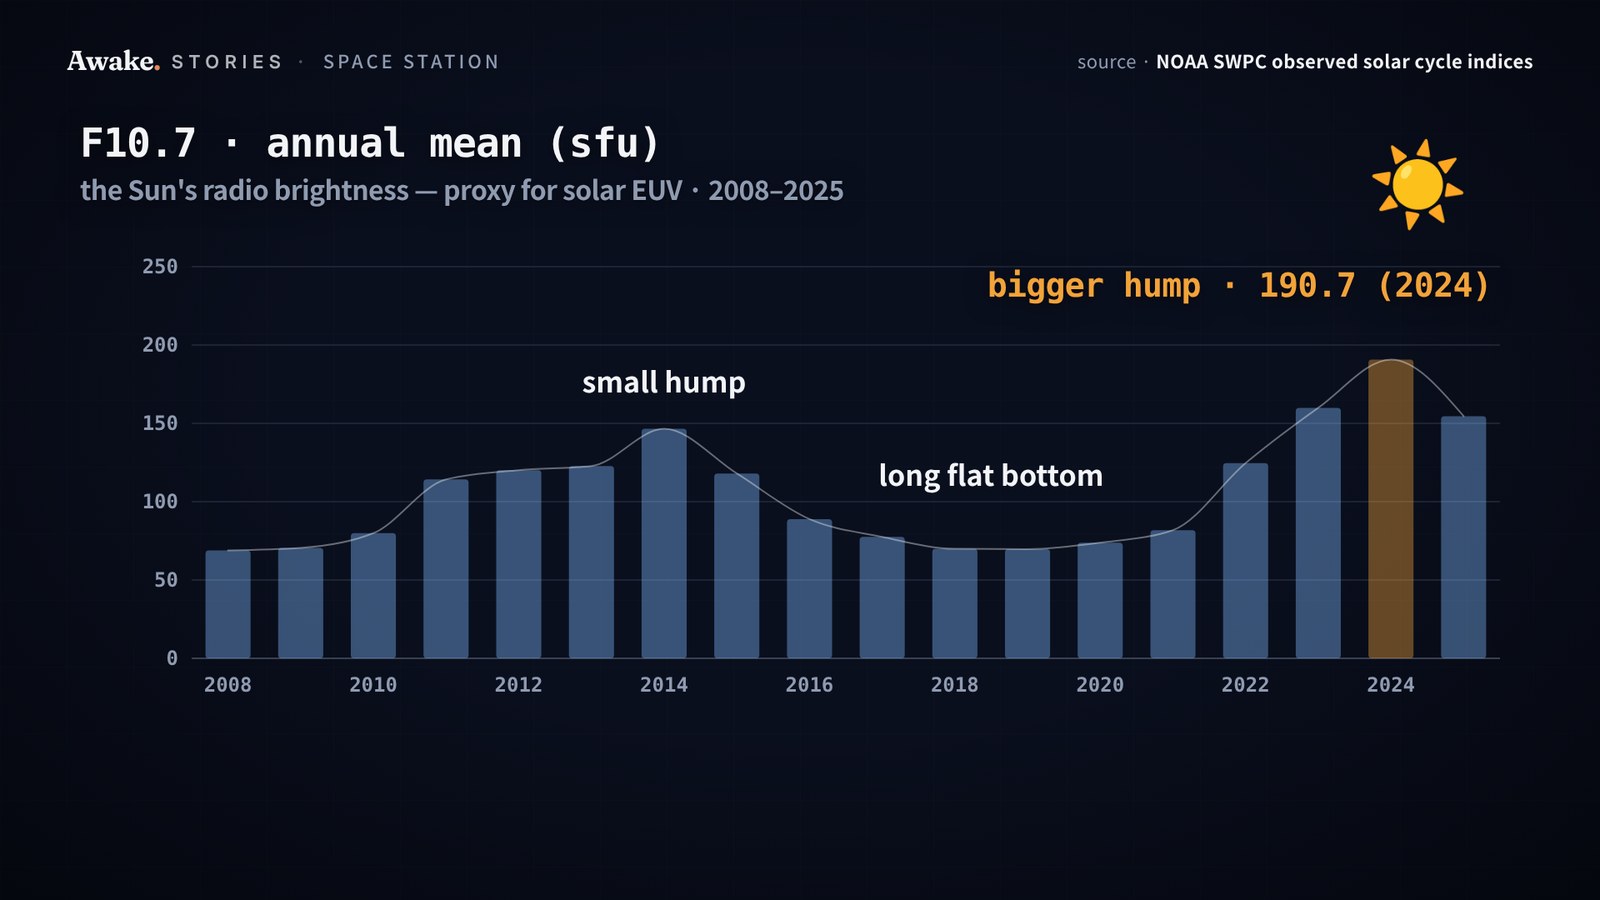
NOAA’s Space Weather Prediction Center publishes the index month by month. Averaged by year from 2008 to 2025, the record has a clear shape: a small hump, a long flat bottom, then a bigger hump. The bigger hump is the current cycle, Solar Cycle 25.
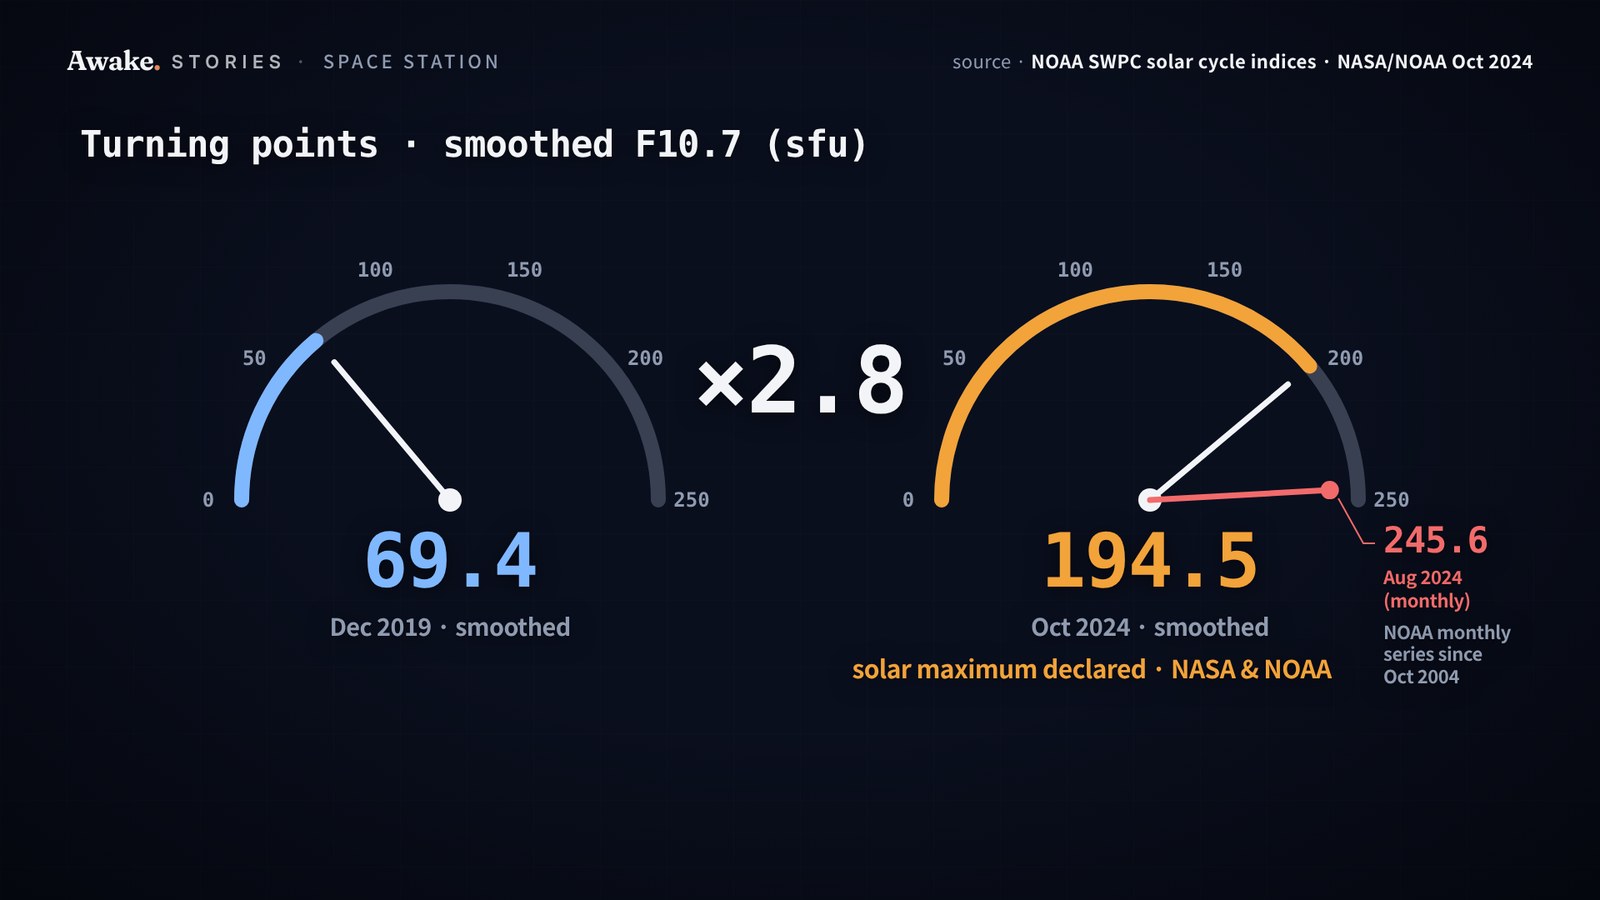
Smoothing the monthly values pins down the turning points. According to NOAA’s observed solar cycle indices, the smoothed flux bottomed out in December 2019 at about 69. It topped out in October 2024 at about 195, roughly 2.8 times the bottom. That same month, NASA and NOAA jointly announced that the Sun had reached solar maximum.
Single months ran higher still. August 2024 averaged 245.6, the highest month in NOAA’s monthly F10.7 series, a series that begins in October 2004 rather than covering the full historical record.
| Point in the cycle | Month | F10.7 (solar flux units) |
|---|---|---|
| Smoothed minimum | December 2019 | about 69 |
| Smoothed maximum | October 2024 | about 195 |
| Highest single month in NOAA’s series | August 2024 | 245.6 |
What the 1997 model runs show
So what does a stormier Sun do to the fall? One caveat first: the video does not check the station’s actual altitude record. What it can show is what NASA’s planners modeled before the station flew.
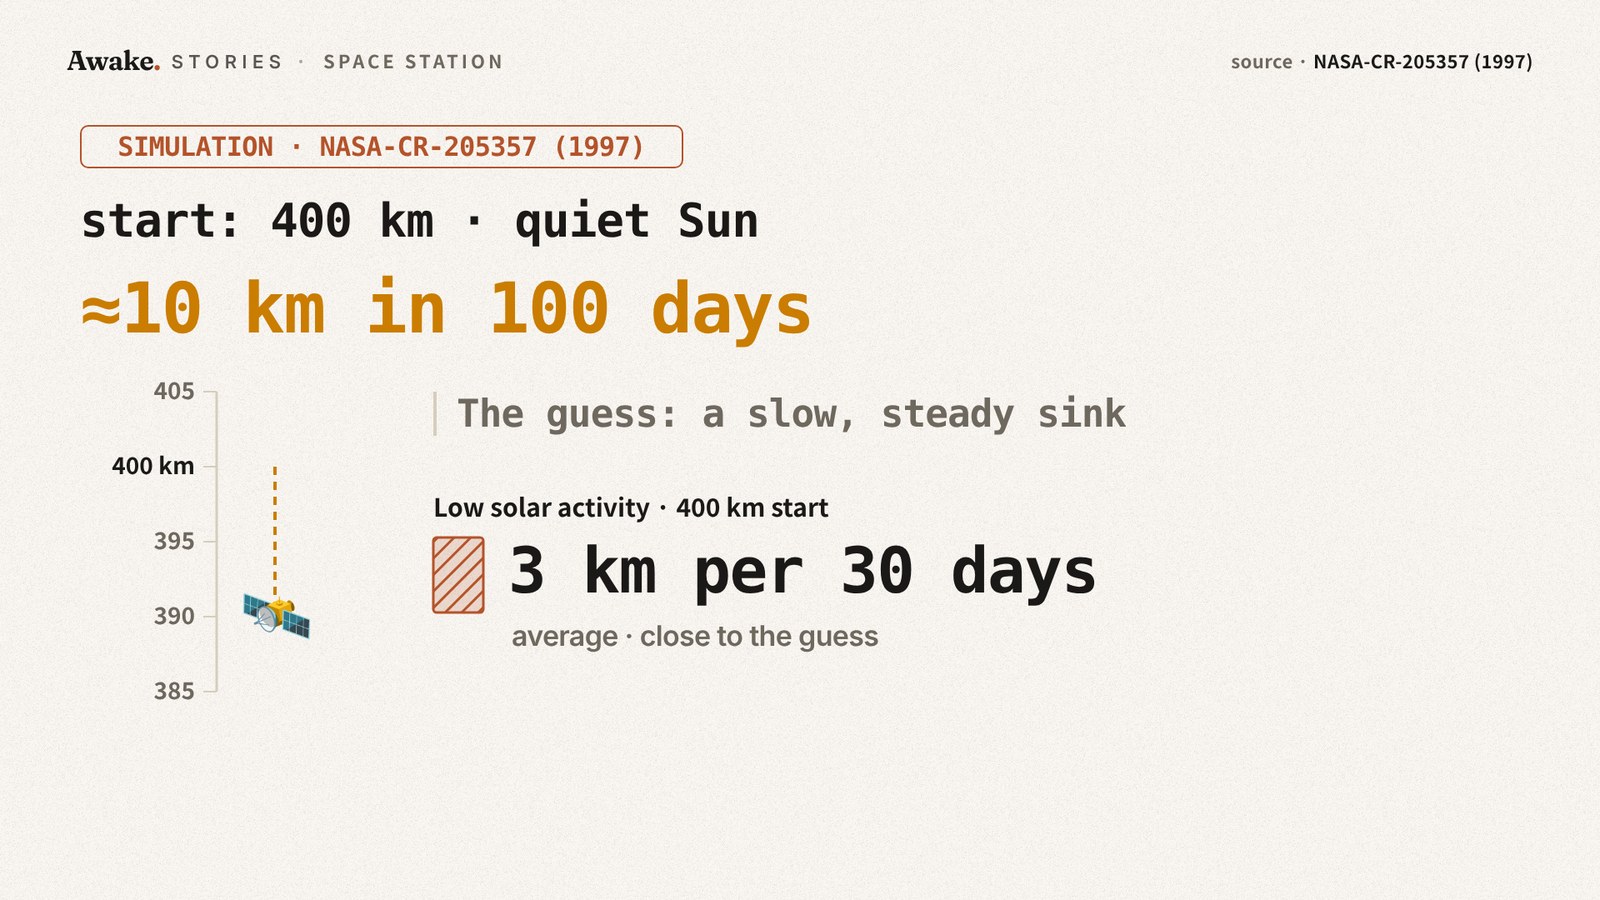
A 1997 NASA-contractor study by Computer Sciences Corporation (NASA-CR-205357) started a simulated station at 400 kilometers. Under low solar activity, the study’s simple decay model had it lose about 10 kilometers in 100 days. That works out to about 3 kilometers every 30 days on average, close to the slow, steady sink most people would guess.
Then the study’s complete model fed in the Sun of January 1958, starting on 22 January of that year. That Sun was far stronger than 2024’s peak: NOAA’s smoothed sunspot number was about 282 in January 1958, against about 161 at the top of the current cycle in October 2024. From the same 400-kilometer start, the simulated station was down to 253 kilometers after 90 days, a drop of 147 kilometers.
That is about 49 kilometers every 30 days on average, roughly 16 times the quiet-Sun pace. The video walks through both runs side by side:
| Model run, 400 km start | Days | Altitude lost | Average per 30 days |
|---|---|---|---|
| Low solar activity (simple model) | 100 | about 10 km | about 3 km |
| January 1958 Sun (complete model) | 90 | 147 km | about 49 km |
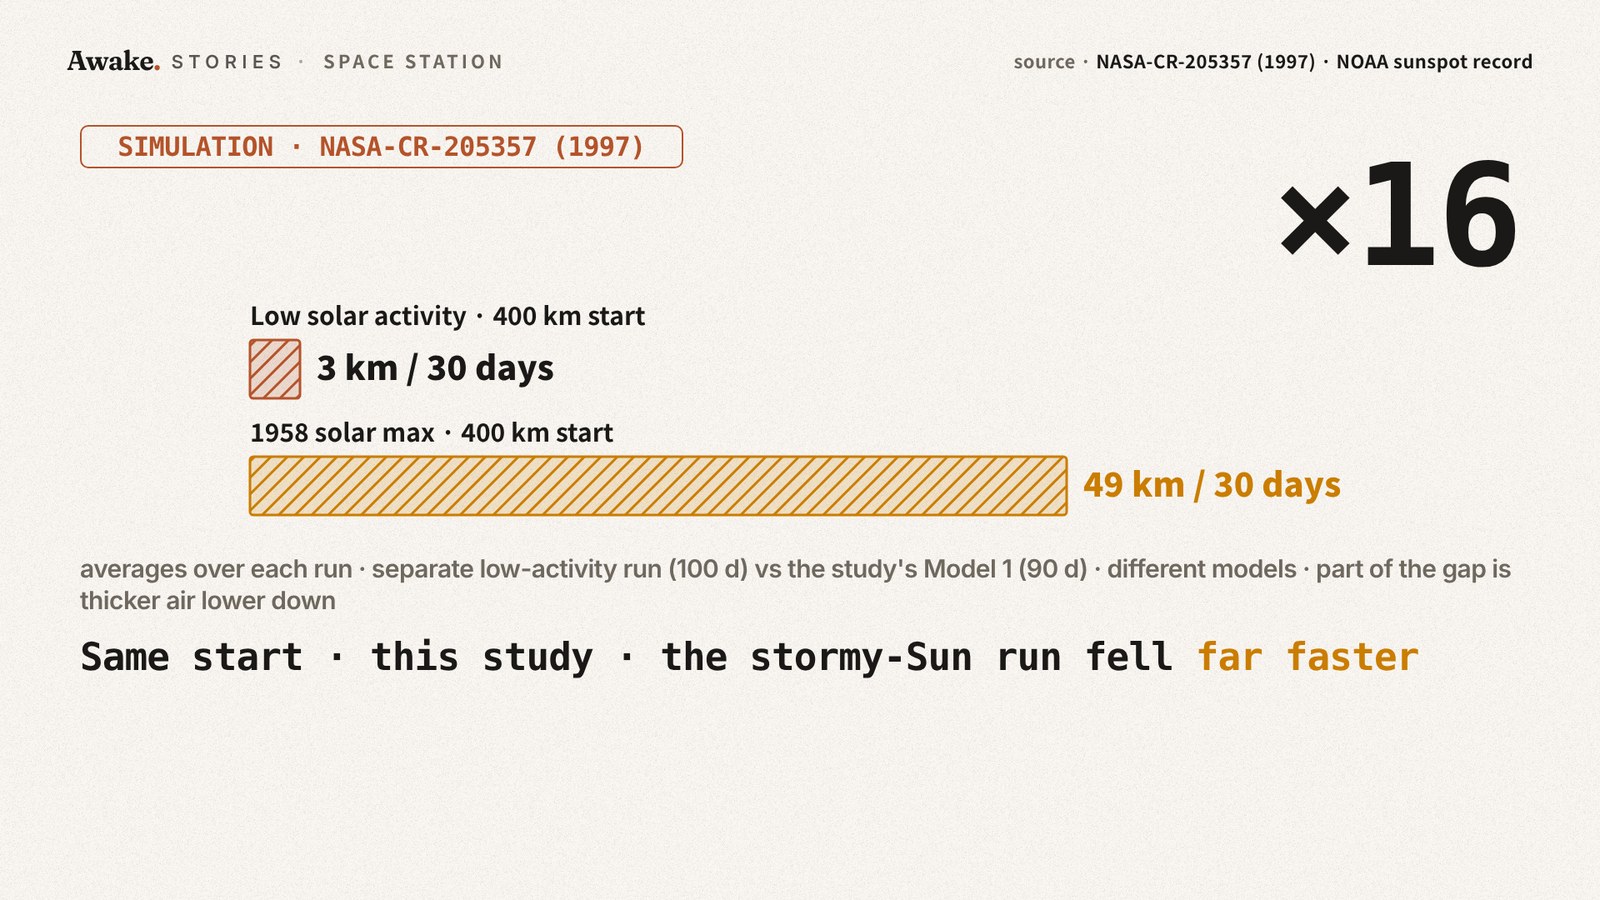
The comparison comes with real caveats. The two runs used different models and different lengths, and part of the gap comes from the stormy-Sun run sinking into thicker air lower down, which speeds the fall further. It is an order-of-magnitude gap, not a precise ratio. Still, within this one study and from the same starting height, the stormy-Sun run fell far faster.
What changes once you see it
Seen this way, the familiar “2 kilometers a month” reads differently. It is an average, and an average can hide big swings. The 1997 runs were a stress test, not a record of what happened, but the same starting height produced very different falls depending on the Sun.
That changes what a reboost means. A burn like November 2025’s buys time, and how much time depends on the Sun. Right now the Sun is calming: NOAA’s monthly flux has eased from 245.6 in August 2024 to about 105 by September 2026. One lever is left, which is where the station starts. Whether flying higher puts it out of reach is the next question.
Sources
- Observed Solar Cycle Indices (monthly sunspot number and F10.7), JSON — NOAA Space Weather Prediction Center (2024) · https://services.swpc.noaa.gov/json/solar-cycle/observed-solar-cycle-indices.json
- Joint Solar Maximum Announcement from NASA and NOAA — NOAA Space Weather Prediction Center (2024) · https://www.swpc.noaa.gov/news/joint-solar-maximum-announcement-nasa-and-noaa
- FAQs: The International Space Station Transition Plan — NASA (2026) · https://www.nasa.gov/faqs-the-international-space-station-transition-plan/
- Neutral Orbital Altitude Density Effects on the International Space Station (NASA-CR-205357) p.16 — NASA / Computer Sciences Corp. (Smith, Adelfang, Smith) (1997) · https://ntrs.nasa.gov/api/citations/19970028145/downloads/19970028145.pdf
- Mission & Carrier Characteristics (ESA SP-1201) — ESA (1997) · https://www.esa.int/esapub/sp/sp1201/a3.htm
- International Space Station (Wikipedia) — Wikipedia (2026) · https://en.wikipedia.org/wiki/International_Space_Station
- Station Orbiting Higher as Exercise Research and Maintenance Continue — NASA (2025) · https://www.nasa.gov/blogs/spacestation/2025/11/19/station-orbiting-higher-as-exercise-research-and-maintenance-continue/
Photos: Video: NASA-Imagery / Pixabay (https://pixabay.com/videos/id-240/) · Image: Luminas_Art / Pixabay (https://pixabay.com/photos/new-year-background-galaxy-star-3608029/) · Image: 12019 / Pixabay (https://pixabay.com/photos/hurricane-earth-satellite-tracking-92968/) · Photo: Kim Petitfils / Pexels (https://www.pexels.com/photo/detailed-sun-with-visible-sunspots-33053394/)
 Up next · Space & ScienceCan Flying Higher Protect the Space Station From the Sun?