How Many People Are in the Sky Right Now? About 1.5 Million
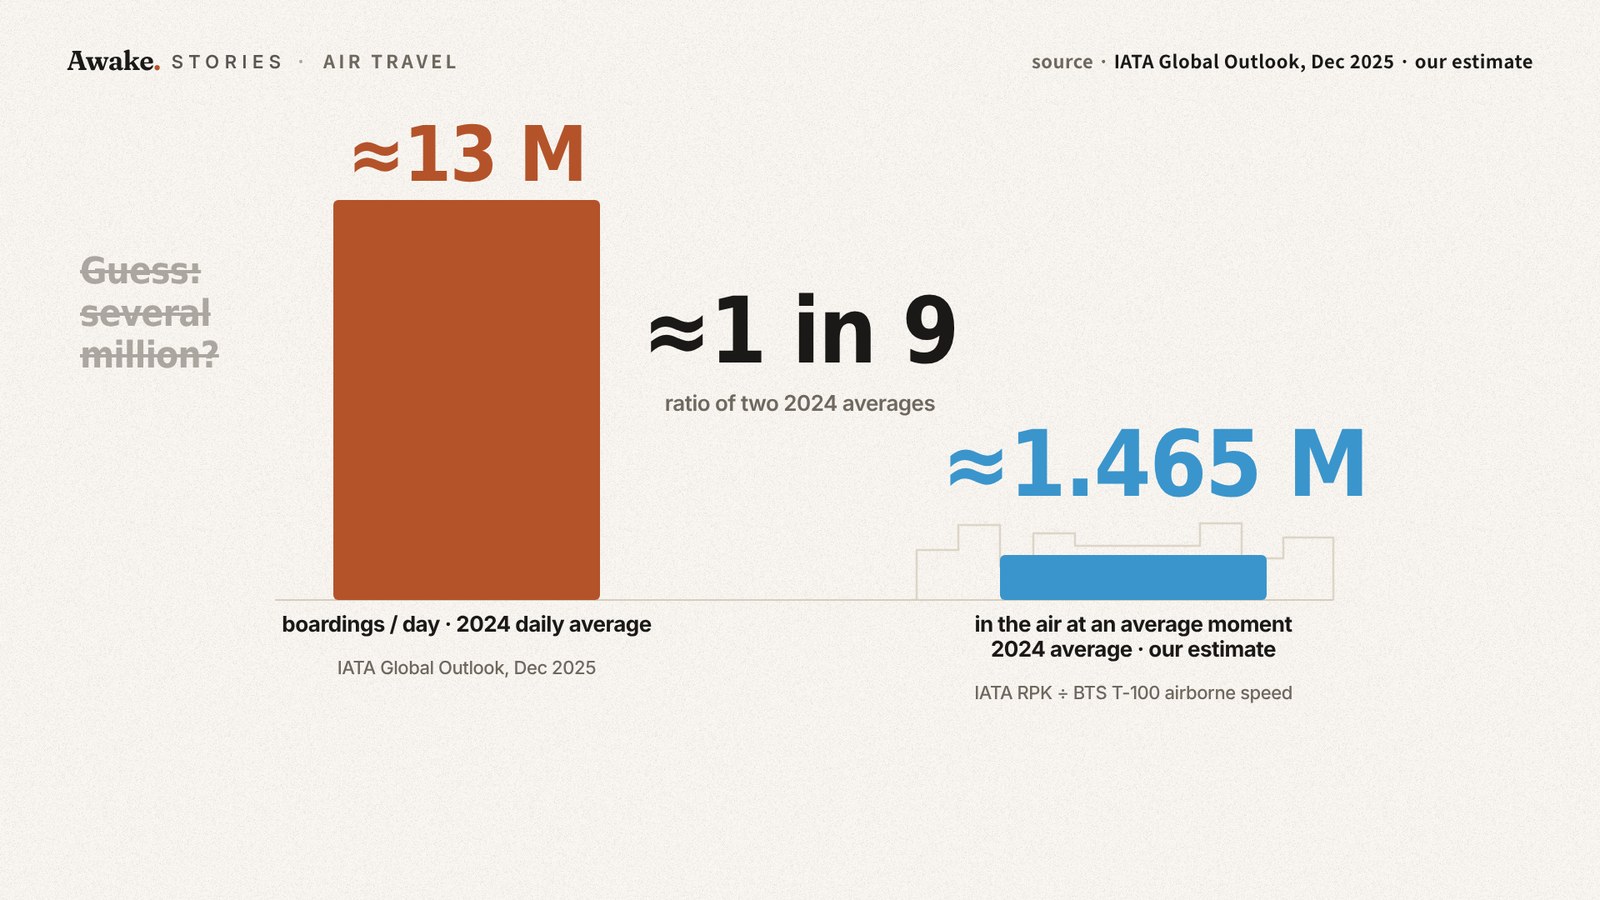
At an average moment in 2024, about 1.5 million paying airline passengers were airborne worldwide, only about one ninth of the 13 million boardings a day.
Prefer reading? The write-up below tells the same story with the same sources. Open on YouTube.
The numbers
Airline passengers aloft at an average moment, 2024
1.5M
Look up on a clear day and you may catch a thin white contrail with a plane at its tip, full of people reading, sleeping and snacking. It is tempting to picture many millions of people overhead at once. The real figure is large, but it is far smaller than the daily traffic suggests, and the reason comes down to a simple ratio of hours.
Why the guess starts big
IATA, the airlines’ global association, counted about 4.77 billion boardings in 2024, according to its December 2025 Global Outlook for Air Transport. A boarding here means one passenger getting on one flight, so a trip with a connection counts twice. Spread across the year, IATA’s total works out to about 13 million boardings every day on average.
Flight trackers tell a similar story of crowded skies. On July 23, 2026, Flightradar24 tracked a record of more than 153,000 commercial flights in a single day, as reported by Airways Magazine, a count that also includes cargo and charter flights. With numbers like these, it seems natural to assume that a big share of those 13 million daily boardings must be airborne at any given moment. Several million, perhaps.
The gap between a day and a moment
America’s skies offer the first clue. The FAA’s “Air Traffic By the Numbers” page says the agency handles about 44,000 flights a day. The same page lists 5,500 aircraft in the sky at peak operational times. The page does not state a reference year for either figure, but the contrast is plain: tens of thousands of flights per day, yet only a few thousand airborne at once, even at the busiest times.
The gap exists because a flight lasts hours while a day lasts 24. Say every flight lasted exactly one hour and departures were spread evenly around the clock. Then at any moment only one twenty-fourth of the day’s flights would be in the air. Longer flights raise that share and uneven schedules make it swing through the day, but the logic holds: the number aloft at a moment depends on how long each trip stays airborne.
How long a boarding stays in the air
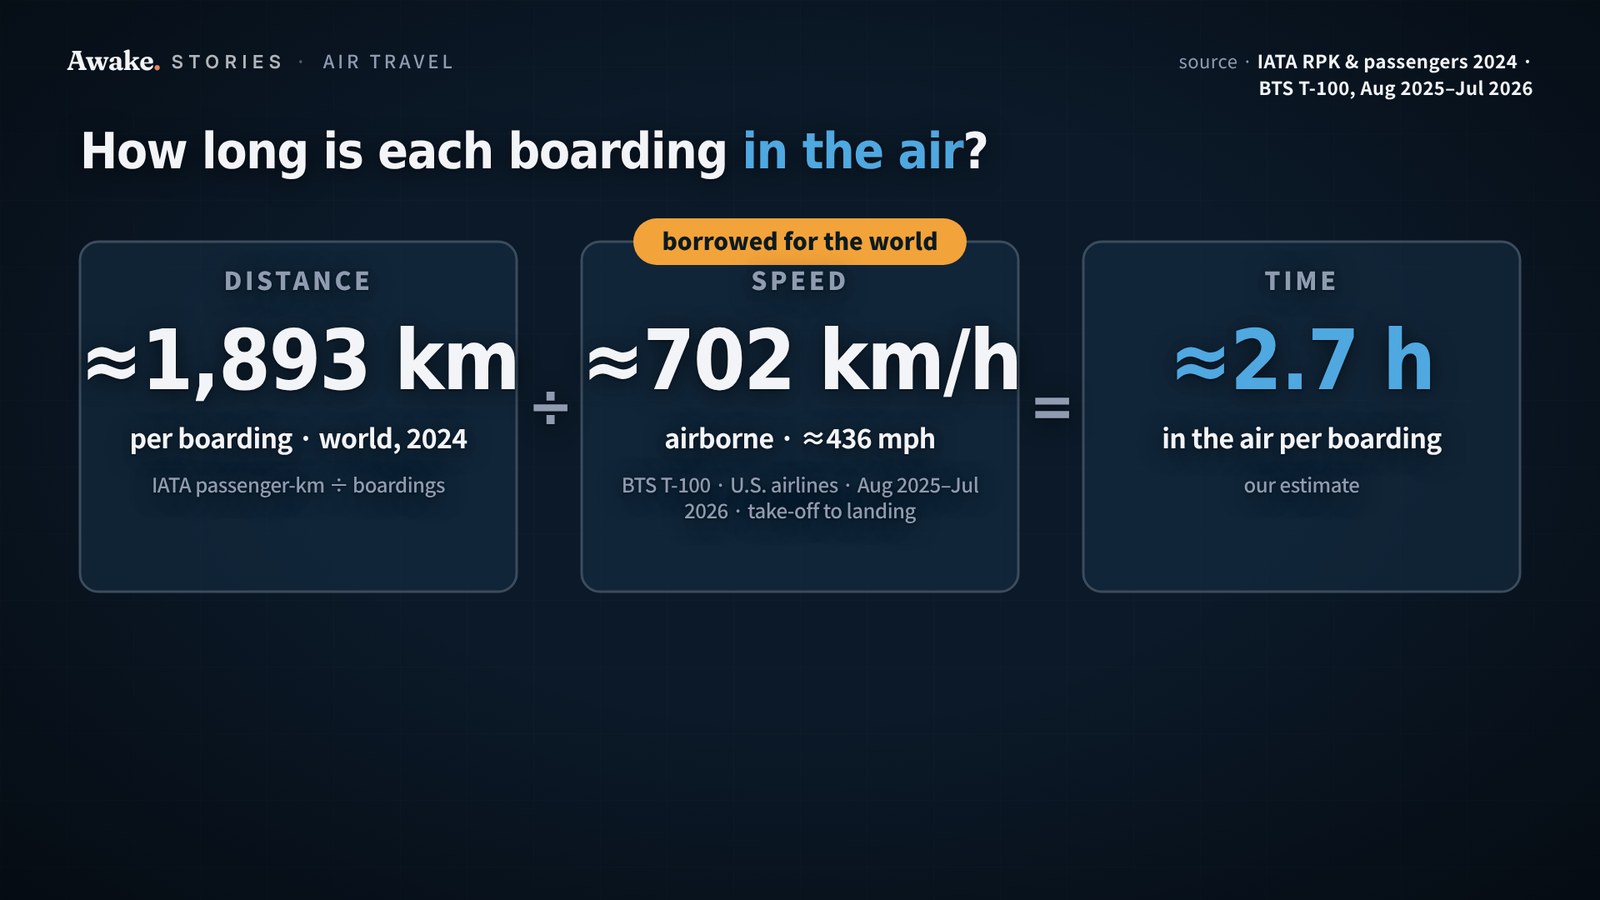
So the key quantity is time in the air per boarding. IATA measures passenger traffic in revenue passenger-kilometres, meaning every kilometre flown by every paying passenger, and put the 2024 world total at about 9,040 billion. Dividing that by the 4.77 billion boardings gives an average of about 1,890 kilometres per boarding.
Distance alone does not give time; that needs a speed. No worldwide airborne speed figure turned up, so the estimate borrows a U.S. one. The Bureau of Transportation Statistics’ T-100 records for U.S. airlines, covering August 2025 to July 2026, put the average airborne speed at about 702 kilometres an hour (about 436 mph), counted from take-off to landing. Divide distance by speed and the average boarding spends about 2.7 hours in the air.
The chain of steps, in order:
- Distance: about 1,890 km per boarding, worldwide, 2024 (IATA).
- Speed: about 702 km/h airborne, U.S. airlines, August 2025 to July 2026 (BTS), borrowed for the world.
- Time: about 2.7 hours in the air per boarding (estimate).
Scaling up, from 2019 through the 2020 cliff
Scaling up uses the same pieces. Take every passenger-kilometre flown in a year and divide by the airborne speed to get the total passenger-hours spent in the air. Then divide by the number of hours in the year. What remains is roughly how many paying passengers are aloft at an average moment.
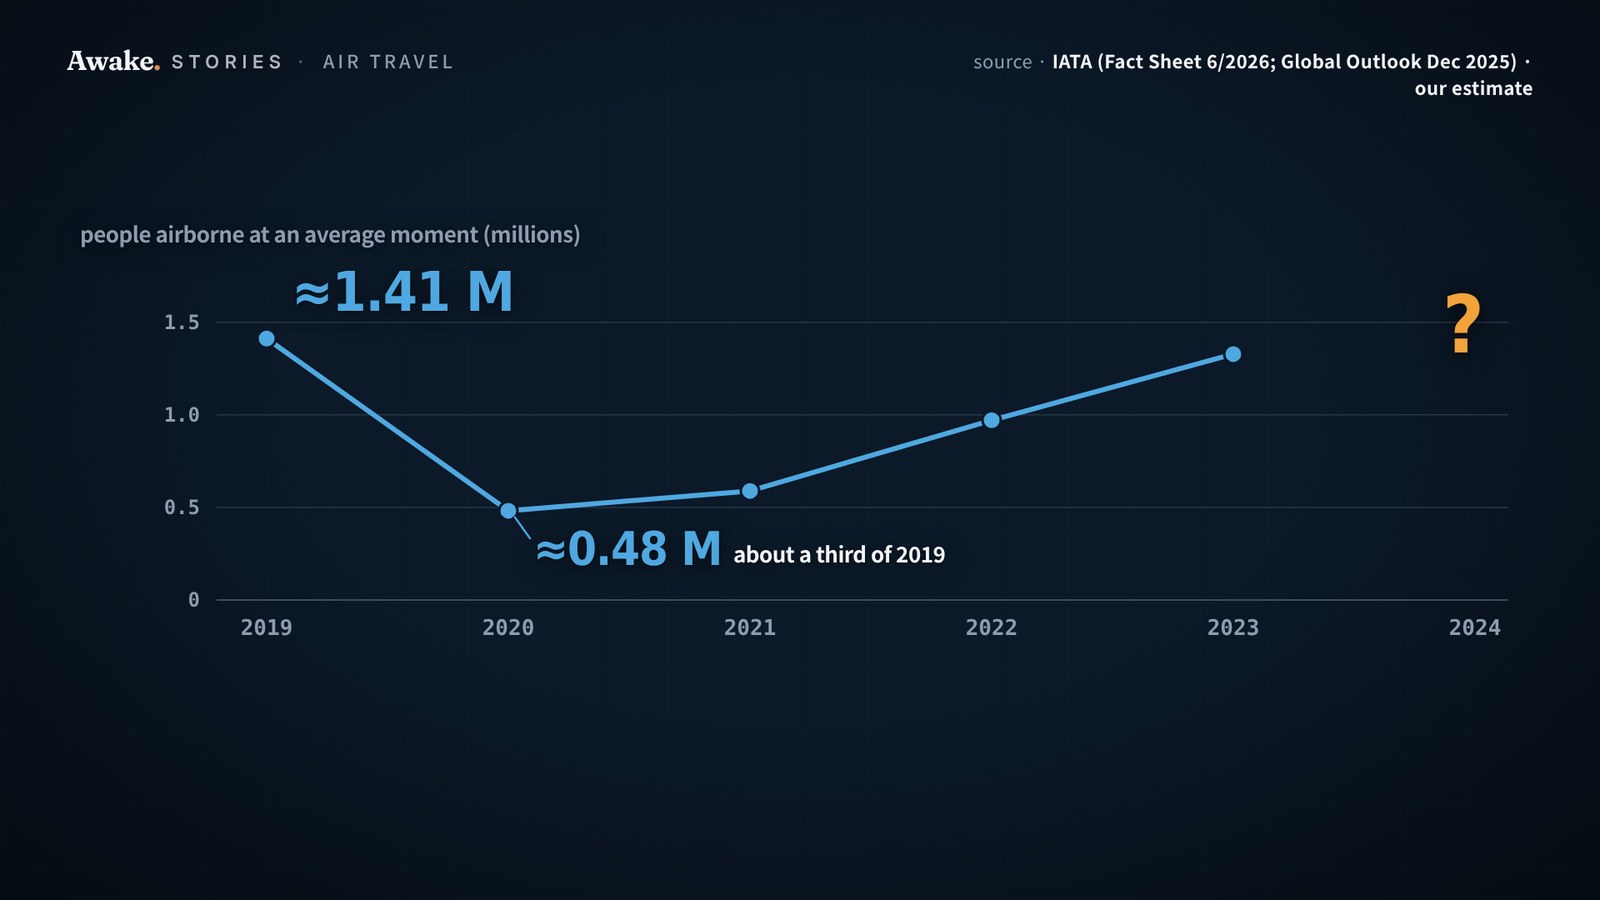
This rests on one stated assumption: that passengers everywhere move at about the U.S. average airborne speed. Run on IATA’s traffic figures for 2019, the calculation gives about 1.41 million people in the air at an average moment.
Then came 2020. World boardings fell 61% from the year before, from about 4.56 billion to about 1.78 billion, according to IATA’s June 2026 industry statistics fact sheet. The estimated number of passengers aloft at an average moment dropped to about 0.48 million, under half a million and roughly a third of the 2019 level.
From there the line climbs back year by year as traffic recovers. The video walks through that recovery on the same chart, holding back the 2024 point for the reveal.
About 1.5 million, or one in nine
For 2024 the line lands at about 1.47 million paying passengers aloft at an average moment, or roughly 1.5 million. Set that against the guess. That same year, IATA’s figures give about 13 million boardings a day, and the number in the air at once is only about one ninth of that, or about 11%.
| 2024 measure | Value |
|---|---|
| Boardings per day (IATA, daily average) | about 13 million |
| Passengers aloft at an average moment (estimate) | about 1.47 million |
| Ratio | about 1 in 9 |
That is a big city’s worth of people in the sky. But it is only a small slice of a day’s boardings. The ratio compares two annual averages; it is not the share of distinct people who fly on a particular day.
Why the number is smaller, and how sure it is
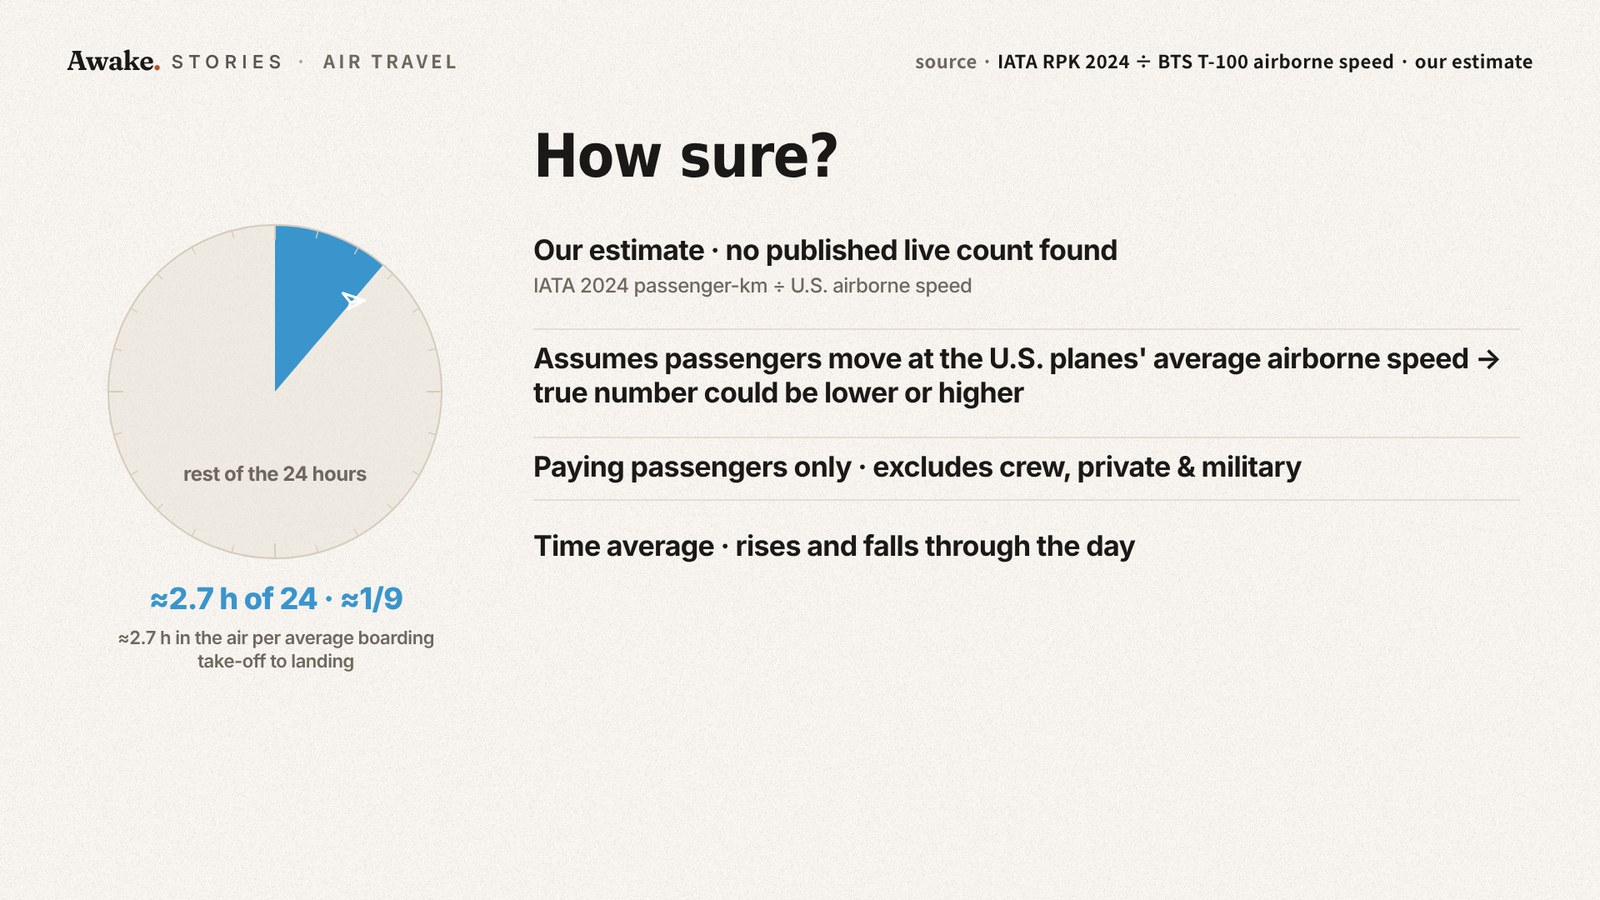
The one-in-nine ratio comes straight from time in the air. The average boarding spends about 2.7 of the day’s 24 hours airborne, which is about one ninth. Every boarding takes its turn in the sky, but each turn is short compared with the length of a day.
The estimate has clear limits, and they matter for reading it:
- No published live worldwide count turned up, so this is an estimate built from IATA’s 2024 passenger-kilometres and a U.S. speed.
- If passengers worldwide move faster or slower than U.S. planes on average, the true figure could be lower or higher.
- It covers paying passengers only, with no crew, private jets or military flights.
- It is a time average. The real count rises and falls through the day as schedules peak and thin out.
What changes once you see it
The sky is not packed with everyone who flies that day. It is more like a city that never lands, with a population that keeps changing as some passengers touch down and others take off.
For scale, a check as of October 13, 2026 counts 10 people in space: seven on the International Space Station, based on NASA crew information, and three on China’s Tiangong. Set the 2024 airline average against that crew count, two different periods and so only a rough comparison, and roughly 150,000 airline passengers are aloft at an average moment for each person in orbit. The next time you spot a thin white line across the sky, you are looking at one street in that city.
Sources
- Air Traffic By the Numbers — Federal Aviation Administration (FAA) (2026) · https://www.faa.gov/airtraffic/air-traffic-numbers
- Global Outlook for Air Transport – Trade, AI, and the energy transition (December 2025), p.11 table — IATA Sustainability and Economics (2025) · https://www.iata.org/en/iata-repository/publications/economic-reports/global-outlook-for-air-transport-december-2025/
- Industry Statistics Fact Sheet (Updated: 6/2026), p.1 — IATA Sustainability and Economics (2026) · https://www.iata.org/en/iata-repository/pressroom/fact-sheets/industry-statistics
- U.S. Air Carrier Traffic Statistics — Twelve Months - System (T-100 Market and Segment), data through July 2026 — U.S. Bureau of Transportation Statistics (BTS) (2026) · https://www.transtats.bts.gov/TRAFFIC/
- Flightradar24 Tracks Record 153,359 Commercial Flights in One Day — Airways Magazine (2026) · https://airwaysmag.com/new-post/flightradar24-record-commercial-flights-july-2026
- Crew-12 Ready to Depart as New Residents Begin Advanced Health Research (ISS blog) — NASA (2026) · https://www.nasa.gov/blogs/spacestation/2026/10/06/crew-12-ready-to-depart-as-new-residents-begin-advanced-health-research/
- China launches Shenzhou-23 crewed spaceship — China Aerospace Science and Technology Corporation (CASC) (2026) · https://english.spacechina.com/n17212/c4616641/content.html
Photos: Video: Dave Planes / Pexels (https://www.pexels.com/video/jet-airplane-in-clear-blue-sky-with-contrails-34103198/) · Photo: Atlantic Ambience / Pexels (https://www.pexels.com/photo/airport-departures-board-12940608/) · Photo: Curtis Cheng / Pexels (https://www.pexels.com/photo/commercial-airplanes-at-new-york-airport-runway-33944835/) · Photo: Damir K / Pexels (https://www.pexels.com/photo/contrail-on-clear-sky-19896938/) · Photo: Jan van der Wolf / Pexels (https://www.pexels.com/photo/contrails-on-blue-sky-16648514/)
 Up next · Space & ScienceHow fast does the Space Station fall? It depends on the Sun


