Can Flying Higher Protect the Space Station From the Sun?
In a 1997 NASA-contractor simulation under a 1958-strength Sun, a station starting at 450 km lost 45 km in 90 days. From 400 km, it lost 147 km.
Prefer reading? The write-up below tells the same story with the same sources. Open on YouTube.
The numbers
Lost in 90 days from a 450 km start (1997 simulation)
45 km
Under a Sun as active as the one in early 1958, a space station left at 400 kilometers with no engine pushes could re-enter within 100 days, according to a 1997 NASA-contractor study. The obvious fix sounds almost too simple: fly a little higher. The same study tested exactly that, and the result is much larger than the guess, though not as reassuring as the word “safe” suggests.
The question the 1997 study tested
The study is “Neutral Orbital Altitude Density Effects on the International Space Station” (NASA-CR-205357), written by Computer Sciences Corp. for NASA in 1997, before the station was assembled. It modeled how fast a station of the 1997 design would lose height to atmospheric drag, with no reboosts to push it back up.
An earlier comparison from the same study showed a much faster average fall under an active Sun than under a quiet one. That comparison mixed two different calculations, though, and the faster run also sank into denser air on the way down. So the cleaner question is a narrower one: under the same Sun and the same model, does starting higher actually cut the fall?
The study’s complete orbital decay model, which the authors call Model 1, answers that directly. It ran twice from the same date, 22 January 1958, which the study describes as a high solar activity condition: once from 400 kilometers and once from 450.
How active was that Sun? January 1958 falls within solar cycle 19. NOAA’s Space Weather Prediction Center records a smoothed sunspot number of about 282 for that month. For comparison, the peak of the current cycle, Solar Cycle 25, came in October 2024 at a smoothed sunspot number of about 161, by the same NOAA record.
That gap matters for reading everything that follows. The simulated Sun was far more active than anything the station has faced in its most recent solar maximum, and a more active Sun means a more swollen atmosphere for the station to push through.
The guess: 50 kilometers is a short step
Before looking at the result, it helps to make the intuitive bet. Fifty extra kilometers is a small step on top of 400. And ESA’s 1997 planning guide for the station, “Mission & Carrier Characteristics” (ESA SP-1201), states plainly that around solar maximum the atmosphere expands.
If the whole atmosphere swells upward, it seems natural that it would swallow both starting heights more or less equally. The guess, then: the 450-kilometer station falls a bit more slowly, but it is the same story.
The 400-kilometer run: 147 kilometers gone
The video lays this out as a simple bar chart. Up the side is altitude lost, in kilometers; along the bottom are the two starting heights. Each run lasts 90 days, and the bars are hatched because they are simulation output for the station as designed in 1997, not a flight record of the real ISS.
Starting at 400 kilometers, Model 1 brought the station down to 253 kilometers after 90 days, according to the NASA-contractor study. That is 147 kilometers lost, or about 49 kilometers every 30 days. That figure is an average over the run, not a constant rate: the fall is not steady from day to day.
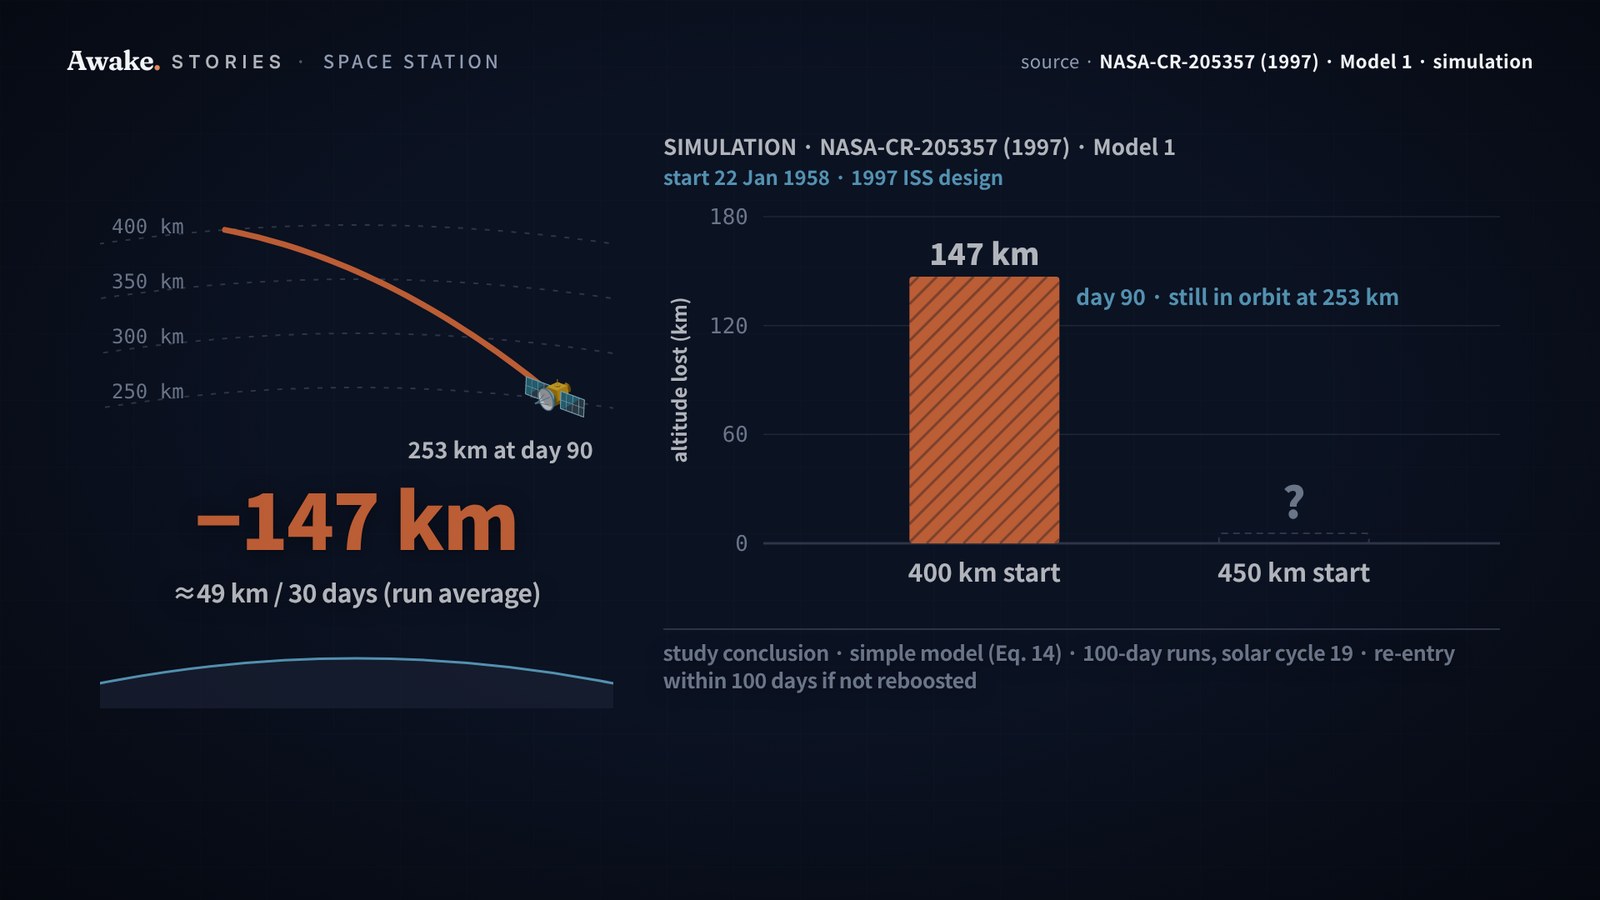
One detail is easy to miss. In this run, the station is still in orbit at day 90. The 100-day re-entry warning in the study’s conclusion came from its simpler orbital decay model (Equation 14), which used 100-day runs under a cycle-19-like Sun. Two different calculations, pointing in the same direction: down, and fast.
ESA’s safe height lands on the second run
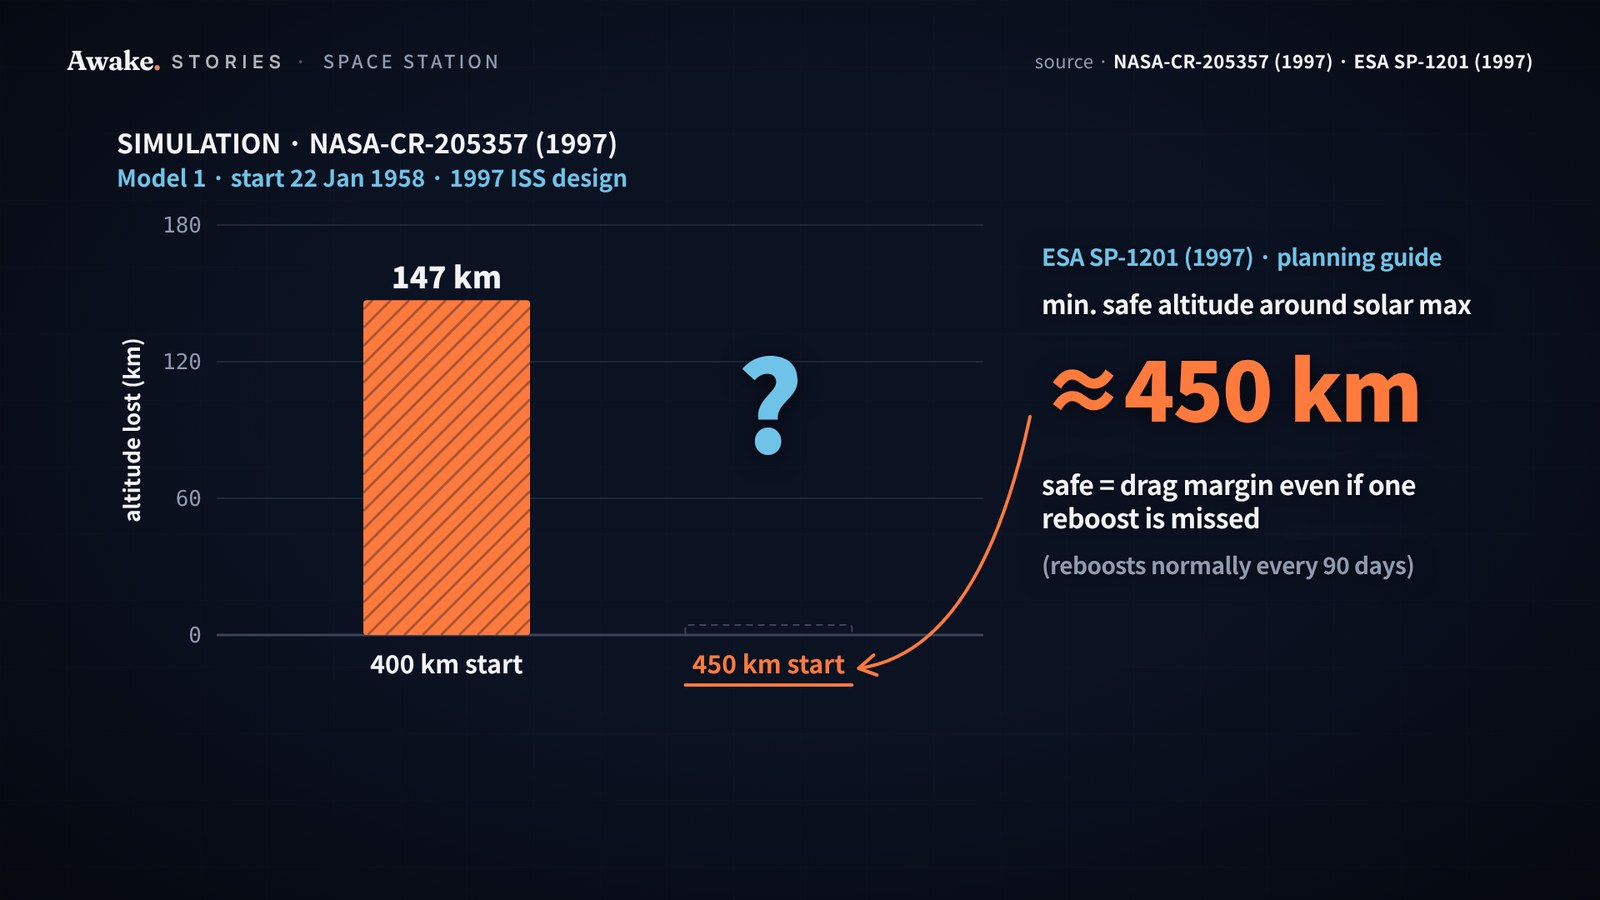
There is one more clue before the second bar fills in, and it comes from the planners. ESA’s 1997 guide put the minimum safe altitude around solar maximum at about 450 kilometers.
“Safe” had a specific meaning there. ESA said the station’s altitude would be kept high enough to limit drag effects even if a reboost manoeuvre was missed, and reboosts were normally scheduled every 90 days. So 450 kilometers is exactly where the second run starts, and 90 days is exactly how long it lasts. The run is, in effect, one normal gap between reboosts with the push skipped.
The twist: most of the fall never happened
From 450 kilometers, the study’s Model 1 brought the station down only to 405 kilometers in 90 days. That is 45 kilometers lost, against 147 from the lower start. On average, about 15 kilometers every 30 days, against about 49.
| Start altitude | Altitude at day 90 | Lost in 90 days | Average per 30 days |
|---|---|---|---|
| 400 km | 253 km | 147 km | about 49 km |
| 450 km | 405 km | 45 km | about 15 km |
Both rows come from the same study, the same model and the same start date of 22 January 1958. Fifty extra kilometers did not slow the story slightly. Most of the fall simply never happened.
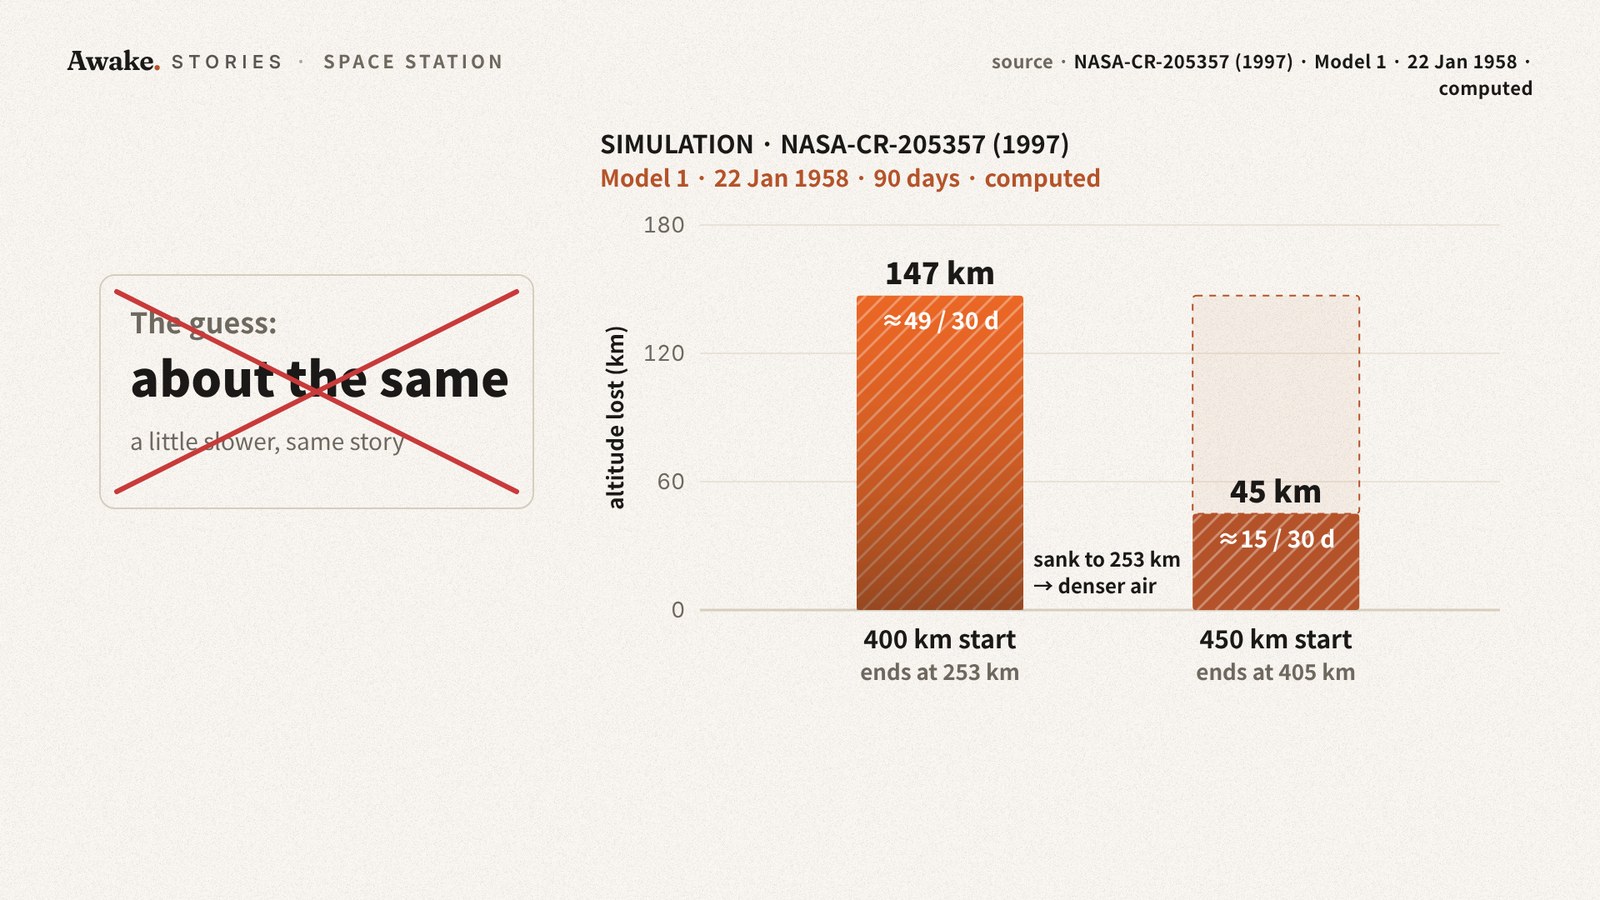
Part of the gap compounds on itself. Air gets denser as altitude drops, so a station that starts lower meets thicker air, loses height faster, and meets thicker air still. The 400-kilometer run ended at 253 kilometers, in far denser air than the 450-kilometer run ever reached, since that one stayed above 400 the whole time.
Safe is a margin, not a floor
The short bar still isn’t zero. ESA’s “safe” never described a height where a station stops falling. It described margin: enough altitude to survive if one push is missed. The 450-kilometer run is exactly that case, one normal 90-day gap with no push, and the station still lost 45 kilometers.
So in this model, height protected the station a lot, but not completely. It bought time. It did not buy an escape.
It is also worth keeping the limits in view. This is a simulation of the 1997 station design, not the ISS as it flies today. And the simulated Sun, with a smoothed sunspot number of about 282, was far stronger than the 2024 peak of about 161. The video walks through each of these caveats on screen, next to the bars they qualify.
What changes once you see it
“Fly higher” starts to sound less like an escape and more like a cushion, and the cushion moves. In its 1997 planning, before the station was built, ESA put the safe height around 450 kilometers at solar maximum, and as low as 350 kilometers when the Sun is quiet. Those were planning margins, not hard floors.
Today’s station operates at about 415 kilometers, according to NASA’s ISS transition plan FAQ. Without reboosts, NASA says, its orbital lifetime would be roughly one to two years, depending on solar activity. Height can soften the Sun. It cannot switch it off.
Sources
- Observed Solar Cycle Indices (monthly sunspot number and F10.7), JSON — NOAA Space Weather Prediction Center (2024) · https://services.swpc.noaa.gov/json/solar-cycle/observed-solar-cycle-indices.json
- Joint Solar Maximum Announcement from NASA and NOAA — NOAA Space Weather Prediction Center (2024) · https://www.swpc.noaa.gov/news/joint-solar-maximum-announcement-nasa-and-noaa
- FAQs: The International Space Station Transition Plan — NASA (2026) · https://www.nasa.gov/faqs-the-international-space-station-transition-plan/
- Neutral Orbital Altitude Density Effects on the International Space Station (NASA-CR-205357) p.16 — NASA / Computer Sciences Corp. (Smith, Adelfang, Smith) (1997) · https://ntrs.nasa.gov/api/citations/19970028145/downloads/19970028145.pdf
- Mission & Carrier Characteristics (ESA SP-1201) — ESA (1997) · https://www.esa.int/esapub/sp/sp1201/a3.htm
- International Space Station (Wikipedia) — Wikipedia (2026) · https://en.wikipedia.org/wiki/International_Space_Station
- Station Orbiting Higher as Exercise Research and Maintenance Continue — NASA (2025) · https://www.nasa.gov/blogs/spacestation/2025/11/19/station-orbiting-higher-as-exercise-research-and-maintenance-continue/
Photos: Video: Scenegraph Studios / Pexels (https://www.pexels.com/video/a-3d-render-of-the-international-space-station-6143464/) · Image: Luminas_Art / Pixabay (https://pixabay.com/photos/new-year-background-galaxy-star-3608029/) · Image: WikiImages / Pixabay (https://pixabay.com/photos/international-space-station-63128/) · Image: 51581 / Pixabay (https://pixabay.com/photos/universe-earth-planet-space-cosmos-1784292/) · Image: myersalex216 / Pixabay (https://pixabay.com/photos/planet-aerial-view-atmosphere-space-2638122/)
 Up next · HistoryFirst Billionaire: Did Rockefeller Ever Actually Reach $1 Billion?